An enhanced simulation-based approach for multicriteria evaluation of SMEs’ performance
- Original Research
- Open access
- Published:
- (2026)
- Cite this article
You have full access to this open access article
- Silvia Angilella1,
- Michalis Doumpos2,
- Maria Rosaria Pappalardo ORCID: orcid.org/0000-0002-7406-03511 &
- …
- Constantin Zopounidis2
Abstract
Stochastic multi-attribute acceptability analysis (SMAA) has become a popular tool for dealing with uncertainties in multi-criteria decision aid. SMAA relies on a simulation process to analyze the performance of a set of alternative options over multiple scenarios for the parameters of an evaluation model and/or the data. The sigma-mu efficiency analysis has been proposed to aggregate the simulation results through a data-driven process that relies on ideas from data envelopment analysis (DEA). In this paper, we extend the sigma-mu efficiency analysis considering not only the mean and the variability of the alternatives’ performance over the simulation scenarios, but also skewness and kurtosis. To model the uncertainty in criteria weights, we employ the flexible Dirichlet distribution, which allows the modeling of the variations in the relative importance of the evaluation criteria. The empirical findings, derived from a dataset of European small and medium-sized enterprises (SMEs) spanning from 2018 to 2022, show that incorporating kurtosis and skewness into the analysis enables a more comprehensive comparison of alternatives. However, this added depth also weakens the dominance relationships between alternatives when considering all four statistical moments.
1 Introduction
Nowadays, sustainable finance is a theme of growing interest, spanning many contexts including, for example: asset portfolio allocation, sustainable financial instruments, or sustainable funding access to firms. It also involves the definition of augmented ratings including, beyond financial factors, Environmental, Social and Governance criteria (ESG, Un, 2004). Such topics have to be considered in the context of the European Green Deal, a set of policy initiatives settled by the European Commission (EC) with the aim of obtaining climate neutrality by 2050. To monitor companies’ sustainability, the EC has required to publish regular reports on the social and environmental risks they face. EC has settled some rules in the Corporate Sustainability Reporting Directive (CSRD) released on 5 January, 2023 (see European Commission, 2024a).
Large companies, as well as listed Small and Medium-sized Enterprises (SMEs), will now report on sustainability. The former will start publishing sustainability reports in 2026. Large companies will follow the European Sustainability Reporting Standards (ESRS), developed by the European Financial Reporting Advisory Group (EFRAG), while for listed SMEs, CSRD is slated to take effect in 2027. In particular, based on some recommendations developed by the European Securities and Markets Authority (ESMA), EFRAG has settled some simplified ESRS specifically for listed European SMEs and some voluntary ESRS for the rest of SMEs. Moreover, a non-binding EU taxonomy is also considered. However, only a small proportion of SMEs are compelled to adhere to the simplified ESRS, or the Voluntary SME ESRS (VSME), released on 12 December 2024 (see EFRAG, 2024), or any simplified ESG reporting framework.
Currently, non-listed SMEs are not obliged to report on their sustainability from the EU Green Deal. Due to the lack of mandatory rules, most SMEs delay starting any initiative to promote sustainability reporting. It can be seen that there are different competitive benefits for SMEs in providing such reports. Good ESG performance will be a prerequisite for accessing financing and maintaining good relations with customers (see Leempoel, 2023).
At the same time, European SMEs face several difficulties in ESG reporting that can be synthesized as follows:
-
Financial constraints related to the SMEs’ resources to disclose ESG data, for example high expenses for consultancy;
-
Lack of expertise: very often SMEs are micro enterprises also young with limited knowledge and skills to collect data;
-
Absence of existing data: data for SMEs are often incomplete or missing. There aren’t historical data;
-
Lack of incentive: at the moment, reporting sustainability is only seen as a burden/cost without a clear benefit for small enterprises.
Considering the crucial role of SMEs, assessing their performance through both financial and environmental sustainability criteria has become increasingly important. To this end, various methodologies combining elements from multi-criteria decision aid (MCDA) with principles of data envelopment analysis (DEA) have been developed to support such multidimensional evaluations through a composite indicator.
A key challenge in constructing composite indicators lies in defining appropriate weighting schemes that accurately reflect the decision-makers’ preferences and the relative importance of each criterion.
The literature offers a variety of weighting approaches (EU and JRC, 2008). Equal weighting is the simplest and most widely applied method. However, it has often been criticized for lacking a solid theoretical foundation and for being more subjective than it appears. Alternative methods are generally classified as either subjective, based on: (i) expert judgments, such as the Analytic Hierarchy Process-AHP (Saaty, 1980) and the Budget Allocation Process-BAP (EU and JRC, 2008, p.96), and (ii) objective, relying on data-driven techniques, such as principal component analysis (Abdi & Williams, 2010), factor analysis (Spearman, 1961), and DEA (Charnes et al., 1978). However, both approaches, typically produce a single weight vector, that represents the preferences of all stakeholders, a strong assumption given the wide diversity of real-world perspectives. To overcome this limitation, within the MCDA context the Stochastic Multicriteria Acceptability Analysis (SMAA), proposed by Lahdelma et al. (1998), was introduced as a more flexible framework as it explores multiple possible weight combinations, thereby accounting for uncertainty of the different perspectives involved in the evaluation process.
Building on this framework, Greco et al. (2019), used the SMAA framework in the Sigma–Mu efficiency analys to summarize the distribution of the composite indicators through two key parameters, namely the mean (\(\mu\)) and the standard deviation (\(\sigma\)). The key advantage of this method is its ability to incorporate all possible viewpoints in building a composite indicator, while also accounting for the distance of each unit from all Pareto–Koopmans frontiers on the \(\sigma -\mu\) plane. These distances are then combined into a single global efficiency score, offering a more comprehensive assessment of performance and robustness.
Recognizing the advantages and flexibility of this methodology in capturing the complex nature of SME sustainability performance, the present paper applies the sigma-mu efficient analysis to aggregate the different points of view (financial and environmental, social, governance criteria) of each SME through a composite weighted sum indicator. A probability distribution for the performance of each SME is obtained by simulating the criteria weights and it is described by the first two moments, i.e., the mean and the variance.
Despite its strengths, the \(\sigma -\mu\) method of Greco et al. (2019) presents two main limitations. First, its results do not always align with the Pareto dominance relations in the \(\sigma -\mu\) plane. Second, it does not consider higher-order moments of the composite indicator distribution, such as skewness and kurtosis, which capture asymmetry and tail behavior, essential aspects for understanding performance variability and risk.
Therefore, subsequent studies have extended and refined the \(\sigma -\mu\) framework. Angilella et al. (2024) developed an iterative algorithm designed to ensure consistency with the dominance relation, thereby enhancing the robustness of the efficiency evaluation. Gaganis et al. (2021) applied the sigma-mu method using a hierarchical structure of criteria, consisting of some principal nodes (the main criteria) and some children nodes (the sub-criteria). In this approach, weights were simulated independently at each level of the hierarchy. More recently, Dias et al. (2025) introduced further methodological refinements by computing only two statistics, i.e. the mean and the variance, specifically for mutual fund portfolio selection. Their contribution represents a significant innovation concerning the sigma-mu framework, introducing a matrix-based weight structure that distinguishes between financial indicators and investment periods, thereby involving two independent sets of weights. This innovation, allows decision-makers to discern whether deviations from the mean are primarily due to the weighting of indicators or that of the time periods. These developments highlight the flexibility and adaptability of the sigma-mu method across different application domains and underscore its potential as a robust tool for performance assessment under uncertainty.
While recent advances have addressed the dominance consistency issue (Angilella et al., 2024), the incorporation of higher-order moments remains largely unexplored.
To address this gap, the methodological contribution of this study lies in three main aspects. First, the sigma-mu efficiency analysis of Angilella et al. (2024) is extended by incorporating skewness (\(\gamma\)) and kurtosis (\(\kappa\)). These higher-order moments provide valuable insights that go beyond the simple measures of central tendency and dispersion captured by the mean and variance in the classical sigma–mu method. They provide additional information on the shape characteristics of the probability distribution of composite indicators, specifically its symmetry and tailedness.
Such metrics have already been considered in several studies dealing with portfolio selection problems (Jondeau & Rockinger, 2006; Kerstens et al., 2011) to better characterize the distribution of portfolio returns. For example, in a recent study, Le Courtois and Xu (2023) have made a joint use of the Dirichlet distribution for the simulation of portfolio weights considering a mean-variance-skewness-kurtosis (MVSK) portfolio optimization problem. In this setting, skewness and kurtosis are not redundant with variance; rather, they provide complementary information about the likelihood and direction of extreme outcomes, which are crucial for risk assessment. Kurtosis captures the magnitude of extreme deviations (downside and upside movements), and can be useful for risk averse investors. Skewness, in turn, offers additional information about the asymmetry of return distributions. While minimizing kurtosis helps reduce exposure to extreme fluctuations, investors typically seek to maximize skewness to mitigate excessive losses.
Building on this rationale, the present study integrates these higher-order moments into the sigma–mu framework to achieve a more refined depiction of uncertainty in firm performance. In this setting, kurtosis has to be minimized since high positive values refer to alternatives characterized by high extreme conditions in their performance. Conversely, skewness has to be maximized as it represents alternatives with the best performance. In fact, high kurtosis indicates “fat tails”, where extreme outcomes occur more frequently, while positive skewness implies the potential for exceptionally high results; therefore, minimizing kurtosis and maximizing skewness allows reducing downside risk while preserving opportunities for extraordinary performance. It assumes a meaningful interpretation as a bonus (for positive values) or penalty (for negative values), added to or subtracted from the evaluation of each alternative.
By integrating skewness and kurtosis with the traditional mean and variance, the proposed approach enables analysts to obtain a comprehensive and nuanced assessment of total risk, capturing not only the magnitude of fluctuations, but also the likelihood and direction of extreme events. In contrast, ignoring these higher order moments can lead to misleading interpretations when data deviate from normality, producing models that fail to represent critical features such as asymmetry, outliers, or heavy tails, thereby reducing the reliability of comparisons across datasets and introducing bias into performance evaluations. Therefore, incorporating these parameters aligns the analysis with the well-established MVSK framework, offering a richer characterization of performance distributions and producing more informative and distinct ranking outcomes.
Second, the inclusion of these higher order moments requires a revision of the SMAA framework, through a more flexible approach for simulating the criteria weights. To this end, and inspired by the work of Le Courtois and Xu (2023), the proposed method adopts the Dirichlet approach (see Jia et al., 1998). This versatile distribution provides a flexible framework that can accommodate a wide range of probability distributions beyond the uniform case, enabling a more nuanced modeling of the criteria weights.
Third, the proposed methodology is empirically tested in a sample of 115 listed European SMEs, to evaluate their performance with respect to financial and ESG criteria during the period 2018–2022. This sample constitutes a central element of our study, as it enables the evaluation of SMEs’ performance from a dual perspective, which has been overlooked by traditional methods due to limited data availability and the absence of a formal and unified directive on ESG disclosure for SMEs. The inclusion of ESG data is not merely illustrative but essential for testing the applicability of the proposed methodology in a real-world, multidimensional decision context, thereby filling a gap in the literature and supporting policymakers and investors who are increasingly engaged in sustainability-oriented strategic choices.
A sensitivity analysis has also been performed to assess the robustness of the resulting rankings under different parameters of the Dirichlet distribution.
The rest of the paper is organized as follows: Sect. 2 presents a brief literature review on studies about SMEs’ performance, specifically focusing on the most significant criteria influencing SMEs’ creditworthiness and on the multicriteria approaches used for its assessment. Section 3 presents the details of the methodological background of efficiency analysis, while section 4 illustrates the proposed methodology. Section 5 is devoted to the empirical analysis and the discussion of the results. Finally, Section 6 concludes the paper and discusses some directions for future research.
2 Literature review
Small and Medium Enterprises (SMEs) are crucial to the EU’s modern economy. Studying their performances is paramount due to several reasons. Firstly, SMEs, which account for 99.8% of all active European enterprises in the non-financial business sector, contribute over 50% to European’s economy total value-added, employ about 67% of the workforce, and drive 50% of private sector innovation (European Commission, 2024b). Secondly, given their integral role in addressing urgent challenges such as climate change, resource efficiency, and social cohesion through innovative solutions, they are essential for the EU’s transition to a sustainable and digital economy. Moreover, fast-growing SMEs, defined as scalers in OECD (2021), play a crucial role in job creation and economic growth.
In the past, SMEs’ performance was largely evaluated through a financial perspective, involving an analysis of various financial ratios. These variables, compared to qualitative information, were easily accessible and objectively measurable, allowing for a more straightforward evaluation and comparison. For instance, Altman and Sabato (2007) considered a set of five financial ratios covering elements like leverage, liquidity, profitability, coverage, and activity to assess SME’s creditworthiness. Similarly, Kyriazopoulos (2019) examined 12 key financial factors, including liquidity, returns, turnover, and solvency, as fundamental benchmarks for shaping the credit risk assessment of SMEs. The common thread across the utilization of these ratios, which were subsequently aggregated into a comprehensive evaluation index, lies in their capacity to provide a clear and measurable assessment of SMEs’ financial well-being. However, SMEs often struggle to access or maintain reliable financial data, making it insufficient for accurately assessing their creditworthiness (Grunert et al., 2005). Hence, other researchers have emphasized the importance of incorporating non-financial information into the analysis (Altman et al., 2010; Czarnitzki & Hottenrott, 2011), as it enhances lenders’ confidence in extending credit (Moro & Fink, 2013). Non-financial factors often refer to “soft" information on SMEs’ internal operations and market-related aspects, such as management efficiency, governance, business, etc.
In this framework, Angilella and Mazzù (2015, 2019) have made important contributions by introducing non-financial risk areas tailored for innovative firms. These encompass development, technological, market, and production risks, together with the scientific proficiency of staff, which depends on their educational background and work experience.
Another stream of research has examined how internal and external characteristics, including the size of firms (Nicolini, 2001), their age (Arend, 2014), the level of innovation (Wolff & Pett, 2006), the position of the market (Gupta & Gregoriou, 2018), the planning and strategy (Aragón-Sánchez & Sánchez-Marín, 2005; Leitner and Güldenberg, 2010), and macroeconomic factors (Cicea et al., 2019), influence access to credit and therefore the performance of SMEs (Hewa Wellalage et al., 2020).
In recent years, there has been a growing interest in sustainability-related topics, primarily driven by the understanding that ESG practices impact firm value (Fatemi et al., 2018; Harrison & Wicks, 2013) and financial performance (Friede et al., 2015; Lins et al., 2017). Notably, a comprehensive literature review focusing on SMEs, has revealed that the majority of analyzed articles provide empirical support for a positive correlation between corporate sustainability practices and the performance and competitiveness of SMEs (Bartolacci et al., 2020). Within this framework, the study of Bhattacharya and Sharma (2019) underscores the importance of ESG disclosure as a critical intangible asset, that enhances corporate reputation and leading to higher credit ratings. This finding is especially significant for SMEs, which often lack of the financial stability enjoyed by larger corporations. Additionally, unlike large publicly traded companies, unlisted SMEs are not currently obligated to disclose sustainability information or their own ESG ratings (European Commission, 2024a), thus placing them at a disadvantage in terms of capital acquisition and investor appeal.
Regarding models, various Multi-Criteria Decision Aid (MCDA) and efficiency-based approaches, such as Data Envelopment Analysis (DEA), have been developed and applied in recent years to evaluate the overall performance of SMEs.
DEA is a non-parametric, efficiency-based approach that constructs efficiency frontiers and can simultaneously handle multiple inputs and outputs (Charnes et al., 1978). This makes it particularly well-suited for evaluating the performance of decision-making units (DMUs), such as SMEs. Early applications primarily focused on assessing SME efficiency and productivity using financial (Balios et al., 2015; Halkos & Tzeremes, 2012) and competitive variables (Enis Bulak & Turkyilmaz, 2014). More recent studies have started to incorporate ESG factors (Iazzolino et al., 2023); however these analyses generally focus on portfolio selection rather than on SMEs.
Variants of traditional DEA, such as two-stage DEA, have been proposed in SME’s evaluation to provide greater comparability across DMUs (Floros et al., 2023). However, both standard and more sophisticated DEA models face some limitations such as sensitivity to outliers and challenges in handling missing data, a very common issue in ESG evaluation. Additionally, all DEA models require the number of inputs and outputs to be significantly smaller than the number of observations. This requirement presents a major challenge in ESG assessments, where a large set of ESG indicators must be considered, but the pool of SMEs reporting such data remains limited.
MCDA techniques provide a robust alternative to DEA approaches by incorporating decision maker (DM) preferences and qualitative judgments. Their flexibility, transparency, and ability to assess both financial and non-financial criteria make them well-suited for evaluating SME performance (Doumpos & Figueira, 2019), with applications often focusing on either financial metrics or sustainability dimensions. For instance, one of the first attempts is provided by Voulgaris et al. (2000), who applied the UTADIS method (Jacquet-Lagreze, 1995) to estimate the performance of a sample of Greek industrial SMEs using financial ratios and to classify them into homogenous classes.
More recently, attention has shifted toward hybrid MCDA methodologies that combine multiple techniques. For example, Angilella and Mazzù (2015, 2019) proposed an integrated approach using ELECTRE-TRI (Yu, 1992) and SMAA-TRI methods (Tervonen et al., 2009) to assess the risk levels of Italian innovative SMEs across different scenarios. This approach facilitated the incorporation of a credit class override in instances of insufficient data availability or when a judgmental rating model, utilizing non-financial information, was suggested. Similarly, Roy et al. (2023) combined the best-worst method (BWM) (Rezaei, 2015) and a variant of the TOPSIS model (Hwang & Yoon, 2012) integrated with fuzzy set theory, to classify SMEs into risk categories. In a related study, Roy and Shaw (2023) replace the BWM approach with a hybrid AHP (Saaty, 1980) for weight assessment, while retained TOPSIS for determining the credit score of SMEs.
Recently, Barro et al. (2025) applied the MURAME outranking methodology of Goletsis et al. (2003) to evaluate a sample of European listed SMEs based on their ESG efforts. This method, which integrates two well-established MCDA techniques, i.e. ELECTRE III (Figueira et al., 2016) and PROMETHEE II (Brans & Vincke, 1985) is particularly well-suited for ESG analysis. It requires minimal assumptions about the decision-maker’s preferences and effectively manage missing ESG data. While MURAME allows for a detailed assessment of both qualitative and quantitative ESG indicators and generates robust rankings that identify ESG leaders and laggards across different model configurations, its main limitations lie in its sensitivity to subjective parameter settings (preference, indifference, and veto thresholds, as well as criteria weights) and limited comparability across studies without standardized criteria.
3 Methodological background
3.1 Preliminary concepts and definitions
To construct a composite index for assessing the performance of SMEs, we consider a very well known and simple aggregation scheme, where the overall value of an alternative \(a_x\), belonging to a set A with \(|A|=m\), is given, on the basis of a set of n criteria, \(G=\{g_1, g_2, \ldots , g_n\}\) by:
with \(g_i(a_{x})\) denoting the performance of \(a_x\) on criterion \(g_i\) and \(w_i\) denoting the criterion weight, defined such that \(\mathbf{w}=(w_1,w_2,\ldots ,w_n) \in \mathbb {R}^n\) belongs to the unit simplex (i.e. \(w_i \ge 0 \,\,\text {and}\,\, \sum _{i=1}^{n} w_{i}=1\)).
We consider an additive value function since it has been widely used for the construction of composite indicators in various contexts and it is easily comprehensible.
3.2 Sigma-mu efficiency analysis
The sigma-mu efficiency analysis, firstly introduced in Greco et al. (2019) and extended in Angilella et al. (2024), is a methodology which combines elements from efficiency measurement and multicriteria decision aid.
The analysis relies on estimates for the expected performance scores of the alternatives and their variability, assessed over all uncertainties that are entailed in the evaluation process. These uncertainties may involve the preferences of the decision maker and/or the characteristics of the alternatives (i.e., the evaluation data). The estimates are obtained by simulating these uncertainties, thus leading to performance scores for the alternatives over multiple evaluation scenarios. The simulation results are typically described through the mean (\(\mu\)) and standard deviation (\(\sigma\)) of the performance scores, which are the inputs to the sigma-mu efficiency analysis.
As pointed out in Dias (2024), if the considered uncertainties only involve the weights of the criteria, then assuming that the weights are uniformly distributed over the unit simplex and the composite indicator is the weighted sum, \(\mu\) and \(\sigma\) can be derived analytically without needing to resort to simulation.
In the same spirit of the seminal work of Markowitz (1952), we recall the Pareto dominance relation, in terms of \(\sigma\) and \(\mu\), defined for any \(a_x, a_y \in A\), as follows:
where \(\gneqq\) means no less than and not equal to and \(\mathbf{0}\) is a zero vector of the same dimension of \([\mu _x- \mu _y, \sigma _y-\sigma _x].\) Thus, \([\mu _x- \mu _y, \sigma _y-\sigma _x]\) indicates that each element is no less than zero and at least one element is not zero.
The sigma-mu Pareto efficiency is tightened by a stricter concept, called sigma-mu Pareto-Koopmans efficiency under which an alternative \(a_x\) is efficient if there is no convex combination \(z=(\mu _z,\sigma _z)\) of the remaining alternatives, with
such that \(a_z\, D\,a_x\), where \(\lambda _1,\ldots , \lambda _m\ge 0\) and \(\lambda _1+\cdots +\lambda _m=1\).
To verify if an alternative \(a_x\) is sigma-mu Pareto-Koopmans efficient, one has to solve the following linear programming (LP) problem:
If there exists a solution of the previous LP and \(\delta _x>0\), then \(a_x\) is Pareto-Koopmans efficient. Let us observe that the signs of \(\alpha\) an \(\beta\) in the first constraint are in accordance with the direction of preference of \(\mu\) and \(\sigma\), respectively, to be maximized and minimized. The efficiency/inefficiency of an alternative is implicitly obtained from the sign (positive/negative) of \(\delta _x\).
The idea underlying the sigma-mu efficiency analysis, introduced in Greco et al. (2019), stems from the remark that in many cases an alternative is quite far from the sigma-mu Pareto-Koopmans frontier (PKF), i.e. the set of best-performing alternatives that offer the most efficient trade-offs between expected performance (\(\mu\)) and variability (\(\sigma\)). For this reason, Greco et al. (2019), following the idea originally introduced by Seiford and Zhu (2003), consider a sequence of sigma-mu Pareto Koopmans Frontiers (PFKs), denoted by \(F_1, F_2, \ldots , F_p\).
Each frontier \(F_k\) at level k consists of alternatives that are efficient (in terms of the Pareto-Koopmans efficiency concept) compared to the rest of the alternatives, excluding those belonging to “higher” (lower level) frontiers, i.e. to \(\mathcal {F}_{k-1} =\{F_1\cup \cdots \cup F_{k-1}\}\).
Then, to test the local efficiency of an alternative with respect to the set of peers \(\mathcal {P}_{k}=\mathcal {I} {\setminus } \mathcal {F}_{k-1}\) relative to frontier k, the following optimization procedure is considered:
Let \(\delta ^*_{xk}\) be the maximum value of \(\delta _{xk}\) derived from the solution of (4). All the alternatives not belonging to \(\mathcal {F}_{k-1}\), such that \(\delta ^*_{xk}\ge 0\), form the local frontier \(F_k\).
Finally, a global efficiency score \(s_x\) for each alternative is given by \(s_x=\sum _k{\delta ^*_{xk}}\), that is normalized on [0, 1] by the following formula:
To take into consideration also the Pareto dominance relation, Angilella et al. (2024) have enhanced the idea of Greco et al. (2019), assessing the local efficiency, differently, for the following two cases of alternatives:
-
(1)
Alternatives from higher-level frontiers that do not dominate any of the remaining alternatives;
-
(2)
Alternatives not assigned to a higher-level frontier that dominate at least one of the remaining alternatives.
The set of alternatives defined by \(\mathcal {D}_x=\{ a_y \in \mathcal {F}_{k-1}\,\,\text {such that}\,\, a_y D a_x\}\) is introduced to synthesize the above cases as follows:
-
(1)
\(\mathcal {D}_x=\emptyset\),
-
(2)
\(\mathcal {D}_x\ne \emptyset\).
For the first case, the standard model of the sigma-mu efficiency analysis (see formula 4) is applied. For the second case, after considering the set of peers against which the performance of an alternative \(a_x\) is evaluated, the same set of peers are used for comparison for all alternatives that dominate \(a_x\). Following this reasoning, an alternative \(a_y\) that dominates \(a_x\) may also dominate other alternatives at level k, thus leading to multiple local efficiency scores, denoted by \(\Delta _{x y k}^*\), each corresponding to the evaluation of \(a_y\) based on the set of peers defined by the dominated alternative \(a_x\).
The final performance score for such comparisons examined at level k is defined by the maximum of all the different results that are obtained at this level. The maximum is selected in order to ensure that the results will be consistent with the dominance relation.
4 The proposed methodology
Having presented in the introduction the main reasons to include the high order moments of probability distribution for the assessment of SMEs’ performance score, this section presents the proposed approach. In Sect. 4.1 we illustrate the algorithm used for simulating the criteria weights with the Dirichlet distribution. In Sect. 4.2 the enhanced simulation approach is described.
4.1 Sampling of the criteria weights
The simulation process considered in this paper resembles the one described in the paper of Jia et al. (1998). Many decision problems are characterized by decision maker’s uncertainty about her/his own preferences. For these reasons, it is useful to represent the criterion weights by means of a probability distribution. The starting point of this process is the choice of the true weights, which are generally unknown. For this reason, the true weights \((\omega _1,\ldots ,\omega _n)\) are generated uniformly on the whole unit simplex of weights.
Then, the assessed weights are sampled from a Dirichlet distribution whose single-attribute means correspond to the true weights. In this way, the assessed weights are unbiased, but subject to a random error.
In accordance with Jia et al. (1998), the generation of random criteria weights starts with the generation of a set of Gamma variables \(d_i \sim \Gamma (\lambda \omega _i,1)\), where \(\omega _i\) is the true weight for attribute i and \(\lambda\) is the scaling parameter, which controls the precision and level of uncertainty of the assessed weights. The criteria weights are then obtained through the normalization \(w_i=d_i/(d_1+\ldots +d_n)\), \(i=1\ldots ,n\). These normalized weights follow the n-variate Dirichlet distribution with parameters \((\lambda \omega _1, \ldots , \lambda \omega _n)\). The mean and the variance of the weights are defined by:
The parameter \(\lambda\) can be interpreted as a concentration factor. The higher is the value of \(\lambda\), the lower is the variability of the sampled weights. For example, considering a set of three criteria (\(n=3\)), with equal true weights (i.e., \(\omega _1=\omega _2=\omega _3=1/3\)), the case \(\lambda =3\) corresponds to criteria weights that are uniformly distributed over the unit simplex (see Fig. 1a). Increasing the \(\lambda\) parameter, reduces the variance, thus leading to more concentrated weights around their mean values \(\omega _i\), as illustrated in Fig. 1b–c. For the purpose of the analysis and the examination of the robustness of the results, we consider three scenarios for the scaling parameter, namely \(\lambda \in \{3, 18, 36\}\), in accordance with Jia et al. (1998).
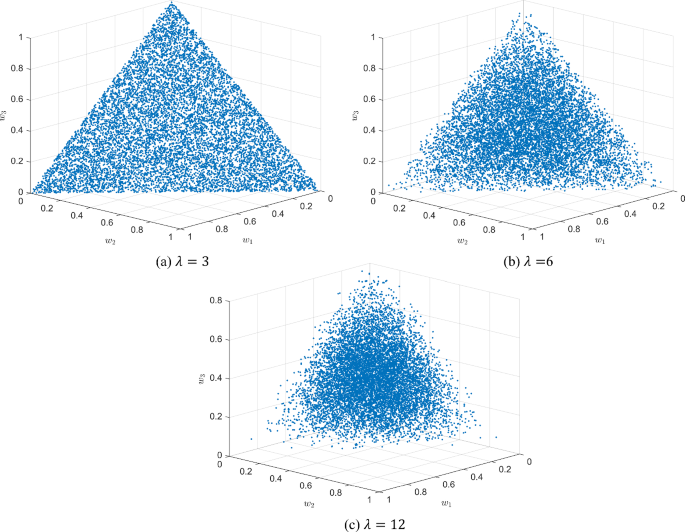
Examples of random criteria weight vectors generated through the Dirichlet distribution with \(n=3\)
4.2 Dominance relation in terms of kurtosis and skewness
With a set of S criteria weight vectors \(\{\mathbf{w}_1,\ldots ,\mathbf{w}_S\}\) generated through the process described in the previous subsection, each representing a different point of view for the evaluation of the alternatives, the additive model (1) is used to derive S evaluations \(V(\mathbf{w}_r, a_x)\), \(r=1,\ldots \,S\), for each alternative \(a_x\). As explained in subsection 3.2, the standard sigma-mu efficiency analysis approach relies on the mean and the standard deviation of the evaluation results across all weight vectors, i.e.:
In the proposed methodology, we enhance this setting by incorporating the skewness and kurtosis parameters, which are defined as follows:
Thus, the distribution of an alternative’s performance score is described by a quadruplet of parameters \((\mu _x,\sigma _x,\gamma _x, \kappa _x)\). Resembling the approach of the paper Le Courtois and Xu (2023), the Pareto dominance relation \(\mathcal {D}\), defined in equation (2), can be enhanced including skewness and kurtosis.
With this enhanced representation, the comparison of the distributions of the performance scores of two alternatives \(a_x, a_y \in A\) is performed in terms of the high-order moments \((\mu _x,\sigma _x,\gamma _x, \kappa _x)\), by considering the following vector:
from which we can define the following dominance relation \(\mathcal {R}\), in terms of the four moments \((\mu ,\sigma ,\gamma ,\kappa )\), for any \(a_x\), \(a_y \in A\):
meaning that each element of \(MVSK_{x,y}\) is no less than zero and at least one element is not zero.
Proposition 1
If \((a_x, a_y) \in \mathcal {R}\), then \((a_x, a_y) \in \mathcal {D}\) for any \(a_x\), \(a_y \in A\).
Proof
Straightforward \(\square\)
Note that the opposite of proposition 1 is not true.
To assess the local efficiency of an alternative in terms of the four moments, we introduce the following definition:
Similarly to Angilella et al. (2024), we distinguish two cases:
-
(1)
\(\mathcal {R}_x=\emptyset\),
-
(2)
\(\mathcal {R}_x \ne \emptyset\).
In the first case, the sigma-mu efficiency analysis (see Eq. 4) is extended by incorporating the two aforementioned shape indices (skewness and kurtosis) as follows:
where \(\mathcal {P}_{k}=\mathcal {I} {\setminus } \mathcal {F}_{k-1}\) is the set of peers for evaluating the local efficiency of the alternatives with respect to frontier k. If there exists a quadruplet \((\alpha ,\beta , \theta , \phi )\) with a non-negative \(\delta _{xk}\) which verifies the LP (9), then \(a_x\) has an evaluation not worse than the remaining alternatives. The signs of \((\alpha ,\beta , \theta , \phi )\) are in accordance with the interpretation of \((\mu , \sigma , \gamma , \kappa )\) given in the introduction. Moreover, we have specified the ordering of the coefficients \((\alpha ,\beta , \theta , \phi )\) such that \(\alpha>\beta>\theta >\phi\). This prioritization places stronger emphasis on the mean performance of the SMEs, followed by volatility, while the two higher moments are given lower importance. This specification avoids situations where an SME will be considered to be in a sound position because its good results on the skewness or kurtosis indicators, while having a low average performance.
In the second case, the set of peers against which \(a_x\) is compared, is also used for comparison for the alternatives that dominate \(a_x\) considering the four moments. Since an alternative \(a_y\) that dominates alternative \(a_x\) can dominate other alternatives, this gives rise to multiple local efficiency scores denoted by \(\Delta ^*_{xyk}\). The final performance score for such comparisons examined at level k is given by the maximum of all the different results that are obtained at this level to ensure that the results will be consistent with the dominance relation.
If \((a_x,a_y) \in \mathcal {D}\), but \((a_x,a_y) \notin \mathcal {R}\), then \(a_x\) and \(a_y\) do not belong to the same frontier obtained after solving the LP (4) in terms of \(\sigma\) and \(\mu\), but they can be on the same frontier on the basis of the LP (9), which takes into account higher-order moments. In such a case, kurtosis and skewness have an impact on the results of the evaluation process, thus enriching the analysis with further information on the alternatives’ risk. This concept is also supported by the cumulative distribution of the performances of the alternatives. If \((a_x,a_y) \in \mathcal {R}\), then \(a_x\) is better than \(a_y\) in terms of cumulative distribution. For illustrating the proposed MVSK model, an extensive application is considered in the following section.
4.3 An example
To illustrate the process of the proposed methodology, let us consider the following didactic example with five alternatives evaluated on the four moments \(\mu\), \(\sigma\), \(\gamma\) and \(\kappa\), shown in Table 1. These alternatives are characterized for their similarity in the first two moments (\(\mu\) and \(\sigma\)) and substantial differences in the last two ones (\(\gamma\) and \(\kappa\)). This example highlights how including them in the MVSK approach can aid in making more informed decisions based on a full understanding of the data’s characteristics. Interestingly, the results of the MVSK model, significantly change the alternatives’ ranking relative to the traditional MV method.
To provide a synthetic overview of the example, the alternatives in terms of \(\mu\) and \(\sigma\), as well as in terms of the four moments \(\mu\), \(\sigma\), \(\gamma\), and \(\kappa\), are also visualized in Figs. 2 and 3, respectively.
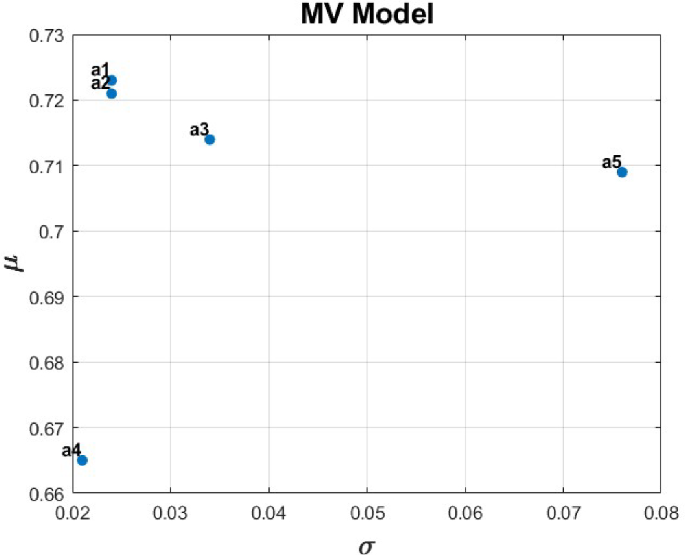
A graphical representation of the alternatives in terms of \(\mu\) and \(\sigma\)
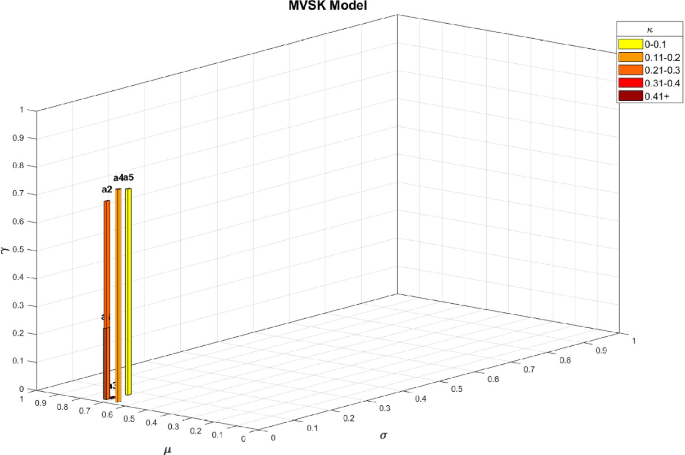
A graphical representation of the alternatives in terms of the four moments
By performing the MV model of Angilella et al. (2024), we obtain the results reported in Table 2, including three PKFs (\(\delta _{x1},\delta _{x2},\delta _{x3}\)) and the global efficiency score \(\bar{s_x}\), which allows us to rank all five alternatives from the best to the worst.
From Table 1, it is evident that considering only \(\mu\) and \(\sigma\), alternative \(a_1\) dominates all others due to its higher mean (0.723) and lower variance (0.024). As shown in Table 2, this enables alternative \(a_1\), to achieve the maximum efficiency score (\(\overline{s_1}=1\)) and be ranked first in the MV model, followed by alternative \(a_2\), which presents a slightly lower mean (0.721) and the same variance than \(a_1\) (with an efficiency score \(\bar{s_2}=0.978\)).
However, when \(\gamma\) and \(\kappa\) are also included in the model, alternative \(a_1\) no longer dominates the others due to its low skewness (0.255), which should be maximized, and its moderate kurtosis (0.355), which should be minimized.
Consequently, applying the MVSK model to the same alternatives produces different outcomes. As shown in Table 3, which reports the results after the MVSK implementation, the model yields a single PKF (\(\delta _{x1}\)) and efficiency scores that differ entirely from those obtained with the MV approach. Specifically, the highest efficiency score (\(\bar{s_x}=1\)) is now achieved by alternative \(a_2\), due to its combination of high mean (0.721) and skewness (0.710) with low variance (0.024) and kurtosis (0.237).
Finally, Table 4 compares the two rankings obtained with the implementation of the two models. It is evident that the alternatives’ ranking differs, leading in some cases to rank reversals. For example, alternative \(a_1\), which was ranked first under the MV model, drops to fourth in the MVSK model due to its moderate value in skewness, while alternative \(a_2\) rises to first place thanks to its high value in the skewness moment.
5 Application
This section presents the empirical analysis of the proposed methodology to assess the performance evaluation of a sample of European SMEs. The presentation starts with the description of the considered dataset (Sect. 5.1) and then proceeds in Sect. 5.2 with an overall overview on the trade-offs of the different moments. The discussion of the results obtained is given in Sect. 5.3.
5.1 Data description
The empirical analysis relies on a dataset of 115 listed European SMEs extracted from the Refinitiv Eikon Datastream database to consider their sustainability practices over the last 5 years available (i.e. 2018–2022).
The selection of the sample was based on the European scheme for the classification of firms by their size, according to which:
-
Small enterprises have between 10 and 49 employees and annual turnover or annual balance sheet total greater than €2 M but not exceeding €10 M;
-
Medium enterprises have between 50 and 249 employees and annual turnover not exceeding €50 M or annual balance sheet total not greater than €43 M.
Starting with these EU definitions, we selected only SMEs located in Europe with an annual turnover between €2 M and €50 M, with available ESG scores in the lastest available year (2022), and operating in all sectors except financial and real estate, due to their budgeting specificity. The details of the sample selection strategy are illustrated in Table 5.
Moreover, since the original sample of SMEs was strongly biased in favor of Sweden (52.17%), a stratification was applied by sector to balance the number of SMEs across countries.
To this end, all companies were first classified by country and sector. Then the total number of Swedish SMEs was estimated using a stratified resampling method, based on the sum of the averages of non-Swedish SMEs per sector.
Therefore, the total number of SMEs was reduced to 66, and Table 6 shows the country distribution of SMEs after the stratified resampling. In this process, the specific 11 Swedish SMEs out of 60 were selected because their total revenues closely matched the average revenues of non-Swedish companies within the same industry.
Finally, to be aligned as much as possible with the aforementioned EU definition of SMEs, the remaining sample of companies, has been further reduced to 46 and classified into small and medium-size enterprises based on their average number of employees in the last 5 years (2018–2022).
The complete list of companies, along with their sectors and countries of incorporation, is reported in Table 15 of the Appendix, while details on the specific criteria used to assess corporate performance are outlined in Table 7. The selection of these criteria was guided by a review of the most relevant literature on the key factors influencing SMEs’ performance. For financial criteria, we incorporated financial ratios presented in the paper of Altman and Sabato (2007) for its proven effectiveness in predicting SMEs’ defaults. We then focused on criteria related to innovation and future growth opportunities, recognizing their critical role in SME’s development, expansion, and competitiveness. For instance, R&D spending, promotes diversification and enhances export capacity; however, it can also pose risks to a SME’s financial stability and long-term profitability if anticipated returns are not realized, especially as it increases the proportion of intangible assets (Nunes et al., 2012). To assess these factors, we considered the ratio of R&D expenses to total revenue (R&D_Intensity)(Sciascia et al., 2015; Nunes et al., 2012) and the proportion of intangible assets to total assets (Future_Growth) (Mateev & Anastasov, 2010). Finally, since good ESG performance in SMEs can enhance capital access and strengthen long-term stability and resilience, ESG factors were also incorporated in our analysis (OECD, 2020).
Table 16 in the appendix, provides the performance matrix for all companies in the sample,Footnote 1 while Table 8 presents the summary statistics based on the evaluation criteria for each year.
5.2 Descriptive findings about two-dimensional representations
Representing companies in two-dimensional subspaces can better display the pairwise trade-off among moments. In this study, such moments, i.e. mean (mu), volatility (sigma), skewness, and kurtosis, have been normalized to enhance both the robustness and interpretability of the results. For example, Fig. 4 illustrates pairwise comparisons between volatility and skewness (top left), volatility and kurtosis (top right) and, skewness and kurtosis (bottom center) for SMEs across countries from 2018 to 2022, with \(\lambda =36\).
The relationship between volatility and skewness does not exhibit any clear pattern, as the companies are scattered rather randomly. However, certain SMEs show a higher density around specific volatility levels, for example 0.4 \(< \sigma<\) 1 on the x-axis, indicating that most observations are concentrated within this range. Skewness (\(\gamma\)) shows greater variability at lower volatility levels. When \(\sigma\) is low (\(0< \sigma <0.4\)), the skewness values are more widely spread, with some reaching as high as 1. As volatility increases (\(0.4< \sigma < 1\)), skewness tends to cluster more around intermediate values (\(0.2< \gamma < 0.6\)).
The relationship between volatility and kurtosis is typically negative and nonlinear: as the volatility of SMEs’ performance increases, kurtosis tends to decrease. This pattern is noticeable when \(\sigma\) falls between 0.6 and 1, where most companies are concentrated in the lower range of kurtosis (0\(<\kappa <0.4\)). However, few SMEs display higher kurtosis values (up to 1), particularly when volatility is low (below 0.5). This suggests that higher volatility is associated with distributions that have less extreme tail behavior, or lower kurtosis, and the clustering of companies around low kurtosis indicates that most SMEs tend to have distributions that are relatively normal or less heavy-tailed.
Finally, the relationship between skewness and kurtosis follows a parabolic, non-linear pattern. Specifically, when skewness exceeds 0.6, kurtosis shows a positive association, increasing proportionally (\(0.08<\kappa \le 1\)). Similarly, when skewness drops below 0.4, kurtosis rises significantly (\(0<\kappa < 0.82\)). In contrast, when skewness is between 0.4 and 0.6, kurtosis remains relatively low (\(0<\kappa <0.4\)). A notable outlier is the French company Innate Pharma which, despite having a skewness value within the intermediate range of \(0.4<\gamma <0.6\) (i.e. \(\gamma =0.5641\)) in 2021, exhibits the highest kurtosis value (i.e. \(\kappa =1\)). The moderate skewness could suggest that most of Innate Pharma’s outcomes were relatively stable. However, the high kurtosis could indicate that the company experienced significant or rare events in 2021, which had a substantial impact on its overall performance. As a biotech company, Innate Pharma may have seen key developments in its drug pipeline, successful partnerships, licensing deals, or noteworthy market reactions, distinguishing its performance from the broader industry trends.

Pairwise comparison of moments (volatility-Skewness, volatility-Kurtosis, Skewness-Kurtosis) across all countries and years with \(\lambda =36\)
5.3 Comprehensive evaluations results
The proposed model, incorporating higher-order moments, has been applied to the dataset of European SMEs, to compute a MVSK performance score for each alternative. Following the methodology proposed by Jia et al. (1998), the simulation process begins by generating a single set of “true" weights for the \(n=10\) criteria used in our analysis. These weights are generated over the unit simplex through algorithm 3 of Rubinstein (1982). Based on these “true" weights, the simulation process described in Sect. 4.1 is employed to analyze the inherent uncertainty with respect to the specification of a “true" vector of weights. This is done by generating random weight vectors through the Dirichlet distribution, with scaling parameters \(\lambda =3, 18, 36\). The simulations performed for each specification of \(\lambda\), are based on \(S=10{,}000\) random weight vectors, each having means equal to the “true" weights. Using the simulated weights, the four statistical moments described in Eqs. (6) and (7) are computed for each SME, and a corresponding rank is assigned. To assess the impact of incorporating skewness and kurtosis into the sigma-mu efficiency framework of Angilella et al. (2024), the rankings generated by the MVSK model are then compared with those obtained using the MV method across all \(\lambda\) scenarios, highlighting both similarities or discrepancies between the two approaches.
The full results are provided in the Supplementary material. Specifically, in the MVSK model, the number of PKFs ranges from 8 to 10, with 9 PKFs being the most commonly identified across various years and scenarios. This set of frontiers is slightly smaller than those derived using the MV approach by Angilella et al. (2024), where the number of PKFs ranges between 12 and 14 over the same periods.
For instance, in 2022 under the scenario \(\lambda =36\), SMEs like OSE Immunotherapeutics (\(a_{20}\)), Dominion Hosting Holding (\(a_{32}\)), Relief Therapeutics (\(a_{4}\)), Asmallworld (\(a_{8}\)), and Meriaura Group (\(a_{12}\)) are placed between PKF 1 and PKF 2 using the MVSK paradigm. In contrast, these same SMEs are distributed between the third and ninth PKFs when applying the sigma-mu approach for the same year.
Table 9 shows the rankings of the SMEs based on normalized global efficiency scores obtained using both the MVSK and MV methods. Table 9, emphasizes notable consistency in rankings across the various scenarios using both methodologies, thereby adding robustness to the analysis.
Table 10, instead, displays the positive and negative changes between the rankings relative to the two models across the three scenarios for each year. More specifically, in Table 10, red bars indicate that the MVSK model produces higher rankings than the MV model, while blue bars show that the MVSK rankings are lower compared to those generated by the MV method.
The MVSK model generally yields higher rankings compared to the MV model for most SMEs in the intermediate positions, particularly in 2021, where approximately 60% of SMEs improve their rankings. For instance, in 2022 under scenario \(\lambda =36\), SMEs such as OSE Immunotherapeutics (\(a_{20}\)) and Eleco (\(a_{21}\)), placed in lower-middle positions by the MV approach (positions 19 and 20, respectively), achieve significantly higher rankings with the MVSK model (positions 9 and 12), with ranking improvements of 10 and 8 positions. Similarly, Zealand Pharma (\(a_{9}\)) and Phaxiam Therapeutics (\(a_{19}\)), placed in intermediate positions by the MV model (ranks 16 and 17), advance by 6 positions under the MVSK model.
In contrast, SMEs occupying top positions (1–5) in the MV model, such as Genfit (\(a_{15}\)), Bactiguard Holding (\(a_{41}\)) and Innate Pharma (\(a_{14}\)), as well as those in high-intermediate positions (7–14), including Dominion Hosting (\(a_{32}\)), Newron Pharmaceuticals (\(a_{31}\)), and Meriaura Group (\(a_{12}\)), lose different positions under the proposed model in 2022. The top-ranked SMEs slip down to ranks 8, 7, and 15, respectively, while the higher-intermediate SMEs drop to positions 18, 27, and 24.
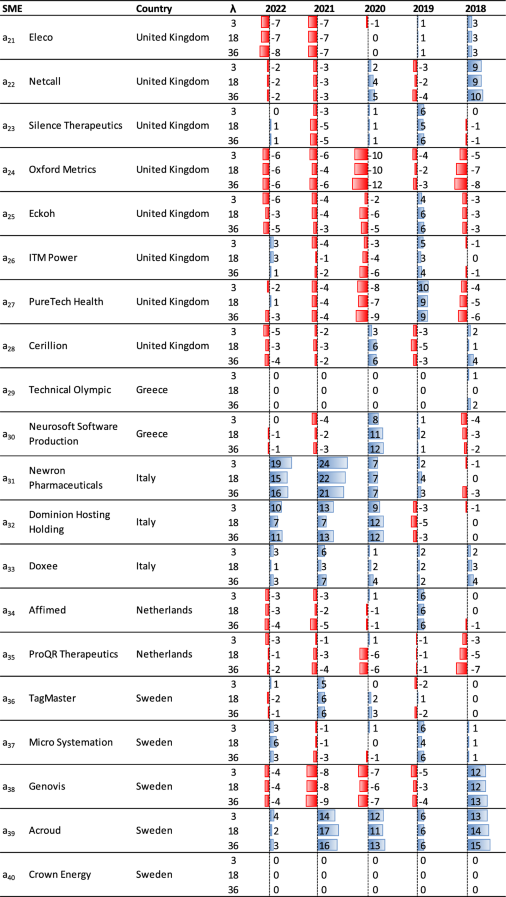
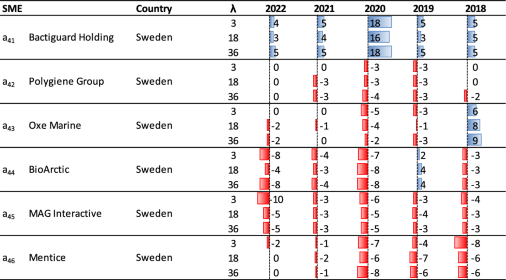
Table 11 highlights the discrepancies in ranking positions between the MVSK and MV models by showing the average deviation across different ranking classes. Specifically, we identified nine interval classes in our sample, with each class containing five rank positions, except for the last, which included six positions. We then filtered the interval classes from the MVSK model by year and scenario, calculated the average deviation from the MV model rankings, and computed the overall mean of these deviations across the three scenarios.
In Table 11, bold values indicate significant average deviation (greater than 5 positions) between the two models, while values marked with an asterisk * denote moderate similarity (deviations between 3 and 5 positions). The table reveals strong similarities in the rankings for the first class and last two classes (ranking positions 0–5, 36–40, and 41–46) during the periods 2021–2019 (class 1), 2020–2018 (class 8), and 2022–2018 (class 9) with mean deviations of less than three positions. Moderate similarities are observed in ranking class 1 for 2022 and 2018, as well as in classes 2, 6, and 7 for most years. In contrast, significant deviations are more prevalent in the intermediate ranking classes (3 and 4) throughout the majority of the years. Notably, 2020 exhibits the largest discrepancies in all classes, except for the first and last three, reflecting the impact of the COVID-19 pandemic. The crisis significantly reshaped the importance attributed to ESG indicators, influencing overall evaluations.
To corroborate the previous findings, the Szymkiewicz-SimpsonFootnote 2 overlap coefficient, a measure of similarity, was computed for each year and scenario. For comparison with the average deviation, the average overlap coefficients between the different scenarios were also calculated. Table 12 emphasizes in bold that the rankings produced by the MVSK and MV models differ considerably (with an overlap coefficient \(< 0.50\)) across most ranking classes (from 2 to 6), reflecting a minimal consensus on which SMEs fits into these categories. In contrast, stronger alignment is observed in the extreme ranking classes, with overlap coefficients \(\ge 0.50\). Specifically, the models consistently agree on the top-ranking SMEs (first class) for the years 2021–2019 and the lowest-ranking SMEs (ninth class) across all years. This indicates that both models reliably identify SMEs in the top and bottom five positions within these opposite ranking categories.
The observed disparities in the set of PKFs, the global efficiency scores, and consequently the final rankings, stem from inherent variations in the methodologies of the two models. In fact, the method proposed in this paper enhances the evaluation process by introducing additional moments, namely skewness and kurtosis, compared to the sigma-mu approach. With the consideration of all four moments, the number of PKFs is slightly reduced compared to the MV model, and the final performance scores are modified.
To emphasize this point further, Fig. 5 illustrates the probability distribution of normalized scores with 10,000 simulated weights, while Table 13 provides four different pairwise comparisons on a subset of SMEs from the sample. For comparison purpose of the two methods, these SMEs were selected since they differ slightly for their values of \(\mu\) and \(\sigma\), while they show more significant disparities in terms of \(\gamma\) and \(\kappa\).
For instance, in the first comparison, SMEs like Newron Pharmaceuticals (\(a_{31}\)) and Meriaura Group (\(a_{12}\)), obtain high-intermediate positions with the MV model, having ranks 11th and 14th, respectively. This is attributed to their comparable mean values (\(\mu _{31}=0.1585\); \(\mu _{12}=0.1409\)) and variances (\(\sigma _{31}=0.1603\); \(\sigma _{12}=0.1773\)). However, their rankings decline under the MVSK model, falling to 27 and 24. This shift occurs because Meriaura Group exhibits higher skewness and kurtosis (\(\gamma _{12}=0.5453\); \(\kappa _{12}=0.0481\)) compared to Newron Pharmaceuticals (\(\gamma _{31}=0.2924\); \(\kappa _{31}=0.0036\)). Indeed, as highlighted by their probability distribution patterns (Fig. 5, first row), Newron Pharmaceuticals exhibits a negative skewness, with its performance scores skewed to the left. This implies that the distribution’s left tail is heavier than its right tail, and the majority of its performance scores lies to the right of the mean, thus diminishing its ranking in terms of MVSK. Conversely, the distribution of Meriaura Group, characterized by positive skewness, concentrates its performance scores on the left side, thereby boosting its MVSK ranking.
In the second comparison, Micro Systemation (\(a_{37}\)) and Evolva Holding (\(a_{2}\)), which are ranked similarly in the MV model (26 vs 28) based on their \(\mu\)-\(\sigma\) values (\(\mu _{37}=0.5557\); \(\mu _{2}=0.5050\) and \(\sigma _{37}=0.5502\); \(\sigma _{2}=0.5554\)), also exhibit comparable ranking positions in the MVSK approach (29 vs 28). However, a rank reversal occurs due to Evolva Holding’s higher skewness and lower kurtosis (\(\gamma _{2}=0.4014\); \(\kappa _{2}=0.0326\)) compared to Micro Systemation (\(\gamma _{37}=0.2908\); \(\kappa _{37}=0.2291\)). As shown in Fig. 5, second row, while Evolva Holding’s distribution remains relatively stable, Micro Systemation exhibits a negatively skewed and leptokurtic distribution in its performance scores, leading to a slight decline in its ranking within the proposed model.
Similar results are observed for the third and fourth comparisons, specifically between Silence Therapeutics (\(a_{23}\)) and Neurosoft Software (\(a_{30}\)), as well as Oxford Metrics (\(a_{24}\)) and ITM Power (\(a_{26}\)), where rank reversals between the MVSK and MV models also occur. (Fig. 5, third and fourth row).
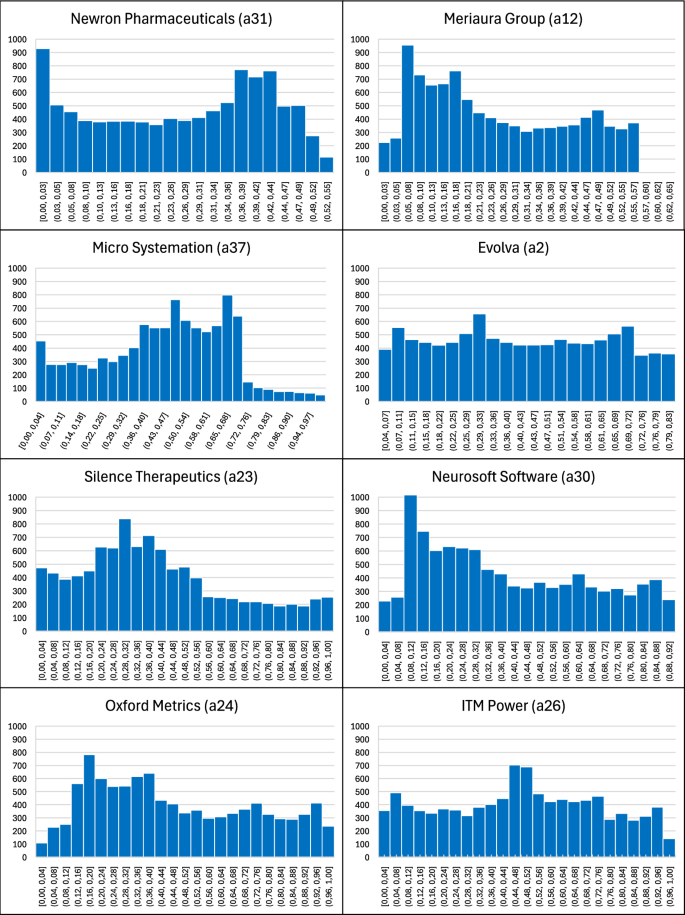
Probability distribution of normalized scores with 10,000 simulated weights for a sub-sample of SMEs in 2022, scenario \(\lambda =36\), with quite similar values of \(\mu\) and \(\sigma\), but different in the values of \(\gamma\) and \(\kappa\)
Thus, while the MV model identifies several dominance relationships (\(\mathcal {D}\)) among alternatives because it relies solely on mean-variance criteria, the MVSK method reduces the number of the dominance relationships (\(\mathcal {R}\)) by incorporating a broader range of moments. This added complexity allows the MVSK approach to offer a more nuanced analysis of dominance. In this regard, Table 1 in the Supplementary material presents the complete set of dominance relationships from both models in 2022, under scenario \(\lambda =36\), while Table 14 lists the dominance relationships among SMEs derived from the MVSK method for the same year and scenario.
6 Conclusions
The adoption of sustainability principles in the corporate world has been a major policy goal, particularly in Europe. To this end, various regulatory directives have been recently issued by European authorities to introduce common practices on reporting of sustainability practices by firms in the context of the ESG framework. These rules apply not only to large companies, but also to SMEs, which constitute the backbone of EU’s economy. For instance, the 2023 Corporate Sustainability Reporting Directive (European Commission, 2024a), requires that all European listed SMEs will start publishing sustainability reports by 2027, while non-listed SMEs will publish sustainability reports on a voluntary basis, in accordance with the Voluntary Sustainability Reporting Standard (EFRAG, 2024).
These policies have increased the focus on ESG reporting by SMEs. For these reasons, there is a great debate among financial experts on methods for evaluating the performance of SMEs with respect to both financial and ESG factors.
To address the growing interest in ESG reporting by SMEs, this paper introduced a multicriteria methodology for evaluating the performance of European SMEs by synthesizing the distribution of composite indicator values, based on ESG, growth and financial factors, incorporating additional parameters beyond \(\sigma\) and \(\mu\), namely skewness and kurtosis. These parameters offer valuable insights into the shape characteristics of the probability distribution of composite indicators, i.e. tailedness and symmetry. We proposed revisiting the SMAA model by adopting the versatile Dirichlet distribution for the criteria weights to capture skewness and kurtosis through the change of some shape parameters. The MVSK performance score was computed for each SME, under various modeling parameter settings on the precision of the assessed weights. Results have been compared with the MV score of Angilella et al. (2024).
The key results derived from the empirical analysis and their primary implications can be summarized as follows:
-
In the MVSK model, the number of PKFs varies between 8 and 10, with 9 PKFs being the most frequently observed across different years and scenarios. This set of frontiers is slightly smaller than those derived using the MV approach;
-
Local and normalized global efficiency scores reveal significant disparities in SME evaluations between the two approaches, especially those in intermediate ranking positions, indicating that higher-order moments substantially influence the performance rankings;
-
The enrichment of the analysis with kurtosis and symmetry allows for a more comprehensive comparison of alternatives, while also impoverishing their inherent dominance relationship in terms of the four moments.
Therefore, the inclusion of skewness and kurtosis allows a more realistic and nuanced differentiation between SMEs. The MVSK approach refines the performance evaluation of companies by capturing distributional asymmetries and tail risks that are overlooked in the sigma-mu analysis. This leads to differences in ranking, or even rank reversals, between the two approaches, particularly for companies with similar mean and standard deviation values but differing in the symmetry and tail behavior of their performance distributions. In such cases, SMEs with higher skewness and lower kurtosis, indicating better and less extreme performance, are preferred under the MVSK model, often improving their ranking compared to the classical sigma-mu method.
Generally, the enhanced methodology offers valuable insights for both investors and policymakers when assessing firm performance. For investors, the comprehensive understanding of risk-performance perspective, enables more informed investment decisions, helping to identify top performer firms that are more stable and less risky in the long run. It allows investors to accurately differentiate between firms that may appear similar under traditional sigma-mu analysis but differ significantly in terms of extreme performance, thus providing a clearer picture of firm stability. For policymakers, MVSK helps identify which SMEs are strong and resilient by considering both financial and ESG metrics. This supports more targeted green policies, promotes fairer regulations, improves access to financing, and contributes to a more sustainable and competitive European economy. The adoption of the flexible Dirichlet distribution for simulating criteria weights, demonstrates its capacity to accommodate complex decision-making scenarios thereby contributing to the improvement of both investment strategies and public policy formulation.
Finally, we envisage the following potential directions for future research:
-
Data management of undisclosed data in the ESG assessment problem;
-
Using the PKF frontiers from the MV and MSVK models to establish credit ratings classes for SMEs;
-
Testing the robustness of the scoring model obtained with a combination of random selection of alternatives and criteria.
Notes
Outliers have been handled through the interquartile range method as proposed in Gasser et al. (2020).
The Szymkiewicz-Simpson overlap coefficient, relative to the set of alternatives in two rankings \(R_1\) and \(R_2\), is defined as:
$$\begin{aligned} S_{kt \lambda }(R_1, R_2)=\frac{|R_1\cap R_2|}{min(|R_1|,|R_2|)}. \end{aligned}$$(10)Rankings \(R_1\) and \(R_2\) correspond, respectively, to the MVSK and MV models, respectively, within a specific ranking class \(k=1,\dots , 9\), for the year \(t=2022, \dots , 2018\), and scenario \(\lambda =3,18,36\); \(|\cdot |\) indicates the cardinality of a set. It divides the size of the intersection of two sets by the size of the smaller set with the purpose of indicating how similar the two sets are.
References
Abdi, H., & Williams, L. J. (2010). Principal component analysis. Wiley Interdisciplinary Reviews: Computational Statistics,2(4), 433–459.
Altman, E. I., & Sabato, G. (2007). Modelling credit risk for SMEs: Evidence from the U.S. market. Abacus,43(3), 332–357.
Altman, E. I., Sabato, G., & Wilson, N. (2010). The value of non-financial information in small and medium-sized enterprise risk management. The Journal of Credit Risk,6(2), 95.
Angilella, S., Doumpos, M., Pappalardo, M. R., & Zopounidis, C. (2024). Assessing the performance of banks through an improved sigma-mu multicriteria analysis approach. Omega,127, Article 103099.
Angilella, S., & Mazzù, S. (2015). The financing of innovative SMEs: A multicriteria credit rating model. European Journal of Operational Research,244(2), 540–554.
Angilella, S., & Mazzù, S. (2019). A credit risk model with an automatic override for innovative small and medium-sized enterprises. Journal of the Operational Research Society,70(10), 1784–1800.
Aragón-Sánchez, A., & Sánchez-Marín, G. (2005). Strategic orientation, management characteristics, and performance: A study of Spanish SMEs. Journal of Small Business Management,43(3), 287–308.
Arend, R. J. (2014). Entrepreneurship and dynamic capabilities: How firm age and size affect the ‘capability enhancement-SME performance relationship’. Small Business Economics,42, 33–57.
Balios, D., Eriotis, N., Fragoudaki, A., & Giokas, D. (2015). Economic efficiency of Greek retail SMEs in a period of high fluctuations in economic activity: A DEA approach. Applied Economics,47(33), 3577–3593.
Barro, D., Corazza, M., & Filograsso, G. (2025). Environmental, social, and governance evaluation for European small and medium enterprises: A multicriteria approach. Corporate Social Responsibility and Environmental Management,32(1), 1291–1308.
Bartolacci, F., Caputo, A., & Soverchia, M. (2020). Sustainability and financial performance of small and medium sized enterprises: A bibliometric and systematic literature review. Business Strategy and the Environment,29(3), 1297–1309.
Bhattacharya, S., & Sharma, D. (2019). Do environment, social and governance performance impact credit ratings: A study from India. International Journal of Ethics and Systems,35(3), 466–484.
Brans, J., & Vincke, P. (1985). A preference ranking organization method. Management Science,31(6), 647–656.
Charnes, A., Cooper, W. W., & Rhodes, E. (1978). Measuring the efficiency of decision making units. European Journal of Operational Research,2(6), 429–444.
Cicea, C., Popa, I., Marinescu, C., & Cătălina Ştefan, S. (2019). Determinants of SMEs’ performance: Evidence from European countries. Economic Research-Ekonomska Istraživanja,32(1), 1602–1620.
Czarnitzki, D., & Hottenrott, H. (2011). R&D investment and financing constraints of small and medium-sized firms. Small Business Economics,36, 65–83.
Dias, L. C. (2024). On the sigma-mu stochastic multicriteria analysis: Exact solutions for common particular cases. Omega,127, Article 103093.
Dias, L. C., Xidonas, P., & Samitas, A. (2025). A novel sigma-mu multiple criteria decision aiding approach for mutual funds portfolio selection. European Journal of Operational Research,322(2), 589–598.
Doumpos, M., & Figueira, J. R. (2019). A multicriteria outranking approach for modeling corporate credit ratings: An application of the ELECTRE TRI-nC method. Omega,82, 166–180.
EFRAG. (2024). Voluntary reporting standard for SMEs (VSME). Retrieved December 20, 2024, from https://www.efrag.org/en/projects/voluntary-reporting-standard-for-smes-vsme/concluded
Enis Bulak, M., & Turkyilmaz, A. (2014). Performance assessment of manufacturing SMEs: A frontier approach. Industrial Management & Data Systems,114(5), 797–816.
European Commission. (2024a). Corporate sustainability reporting. Retrieved June 5, 2024, from https://finance.ec.europa.eu/sustainable-finance_en
European Commission. (2024b). Small and medium-sized enterprises (SMEs). Retrieved May 8, 2024, from https://ec.europa.eu/growth/smes_en
Fatemi, A., Glaum, M., & Kaiser, S. (2018). ESG performance and firm value: The moderating role of disclosure. Global Finance Journal,38, 45–64.
Figueira, J., Mousseau, V., & Roy, B. (2016). ELECTREmethods (pp. 155–185). Multiple Criteria Decision Analysis: State of the Art Surveys.
Floros, C., Lemonakis, C., Tabouratzi, E., Garefalakis, A., & Zopounidis, C. (2023). Efficiency, taxation, and solvency issues for SMEs: The case of Greece, Italy, and Spain. In Essays on Financial Analytics: Applications and Methods
Friede, G., Busch, T., & Bassen, A. (2015). ESG and financial performance: Aggregated evidence from more than 2000 empirical studies. Journal of Sustainable Finance & Investment,5(4), 210–233.
Gaganis, C., Pasiouras, F., Tasiou, M., & Zopounidis, C. (2021). CISEF: A composite index of social, environmental and financial performance. European Journal of Operational Research,291(1), 394–409.
Gasser, P., Suter, J., Cinelli, M., Spada, M., Burgherr, P., Hirschberg, S., Kadziński, M., & Stojadinović, B. (2020). Comprehensive resilience assessment of electricity supply security for 140 countries. Ecological Indicators,110, Article 105731.
Goletsis, Y., Psarras, J., & Samouilidis, J.-E. (2003). Project ranking in the Armenian energy sector using a multicriteria method for groups. Annals of Operations Research,120, 135–157.
Greco, S., Ishizaka, A., Tasiou, M., & Torrisi, G. (2019). Sigma-Mu efficiency analysis: A methodology for evaluating units through composite indicators. European Journal of Operational Research,278(3), 942–960.
Grunert, J., Norden, L., & Weber, M. (2005). The role of non-financial factors in internal credit ratings. Journal of Banking & Finance,29(2), 509–531.
Gupta, J., & Gregoriou, A. (2018). Impact of market-based finance on SMEs failure. Economic Modelling,69, 13–25.
Halkos, G. E., & Tzeremes, N. G. (2012). Industry performance evaluation with the use of financial ratios: An application of bootstrapped DEA. Expert Systems with Applications,39(5), 5872–5880.
Harrison, J. S., & Wicks, A. C. (2013). Stakeholder theory, value, and firm performance. Business Ethics Quarterly,23(1), 97–124.
Hewa Wellalage, N., Locke, S., & Samujh, H. (2020). Firm bribery and credit access: Evidence from Indian SMEs. Small Business Economics,55(1), 283–304.
Hwang, C.-L., & Yoon, K. (2012). Multiple attribute decision making: Methods and applications a state-of-the-art survey, vol. 186. Springer Science & Business Media.
Iazzolino, G., Bruni, M. E., Veltri, S., Morea, D., & Baldissarro, G. (2023). The impact of ESG factors on financial efficiency: An empirical analysis for the selection of sustainable firm portfolios. Corporate Social Responsibility and Environmental Management,30(4), 1917–1927.
Jacquet-Lagreze, E. (1995). An application of the UTA discriminant model for the evaluation of R&D projects. Advances in Multicriteria Analysis,5, 203–211.
Jia, J., Fischer, G. W., & Dyer, J. S. (1998). Attribute weighting methods and decision quality in the presence of response error: A simulation study. Journal of Behavioral Decision Making,11(2), 85–105.
Jondeau, W., & Rockinger, M. (2006). Optimal portfolio allocation under higher moments. European Financial Management,12(1), 29–55.
Kerstens, K., Mounir, A., & van de Woestyne, I. (2011). Geometric representation of the mean-variance-skewness portfolio frontier based upon the shortage function. European Journal of Operational Research,210(1), 81–94.
Kyriazopoulos, G. (2019). Credit risk evaluation and rating for SMEs using statistical approaches: The case of European SMEs manufacturing sector. Journal of Applied Finance and Banking,9(5), 59–83.
Lahdelma, R., Hokkanen, J., & Salminen, P. (1998). SMAA - Stochastic multiobjective acceptability analysis. European Journal of Operational Research,106(1), 137–143.
Le Courtois, O., & Xu, X. (2023). Efficient portfolios and extreme risks: A Pareto–Dirichlet approach. Annals of Operations Research, 1–32.
Leempoel, S. (2023). ESG reporting for SMEs: What to expect and main challenges. Retrieved June 5, 2024, from https://www.greenomy.io/blog/
Leitner, K.-H., & Güldenberg, S. (2010). Generic strategies and firm performance in SMEs: A longitudinal study of Austrian SMEs. Small Business Economics,35, 169–189.
Lins, K. V., Servaes, H., & Tamayo, A. (2017). Social capital, trust, and firm performance: The value of corporate social responsibility during the financial crisis. The Journal of Finance,72(4), 1785–1824.
Markowitz, H. (1952). Portfolio selection. Journal of Finance,7(1), 77–91.
Mateev, M., & Anastasov, Y. (2010). Determinants of small and medium sized fast growing enterprises in central and Eastern Europe: A panel data analysis. Financial Theory and Practice,34(3), 269–295.
Moro, A., & Fink, M. (2013). Loan managers’ trust and credit access for SMEs. Journal of Banking & Finance,37(3), 927–936.
Nicolini, R. (2001). Size and performance of local clusters of firms. Small Business Economics,17, 185–195.
Nunes, P. M., Serrasqueiro, Z., & Leitão, J. (2012). Is there a linear relationship between R&D intensity and growth? Empirical evidence of non-high-tech vs. high-tech SMEs. Research Policy,41(1), 36–53.
OECD. (2020). Financing SMEs and Entrepreneurs 2020: An OECD Scoreboard. Paris: OECD Publishing.
OECD. (2021). Understanding firm growth: Helping SMEs scale up. OECD Studies on SMEs and Entrepreneurship: OECD Publishing, Paris.
Rezaei, J. (2015). Best-worst multi-criteria decision-making method. Omega,53, 49–57.
Roy, P. K., & Shaw, K. (2023). A credit scoring model for SMEs using AHP and TOPSIS. International Journal of Finance & Economics,28(1), 372–391.
Roy, P. K., Shaw, K., & Ishizaka, A. (2023). Developing an integrated fuzzy credit rating system for SMEs using fuzzy-BWM and fuzzy-TOPSIS-Sort-C. Annals of Operations Research,325(2), 1197–1229.
Rubinstein, R. Y. (1982). Generating random vectors uniformly distributed inside and on the surface of different regions. European Journal of Operational Research,10(2), 205–209.
Saaty, T. L. (1980). The analytic hierarchy process (AHP). The Journal of the Operational Research Society,41(11), 1073–1076.
Sciascia, S., Nordqvist, M., Mazzola, P., & De Massis, A. (2015). Family ownership and R&D intensity in small-and medium-sized firms. Journal of Product Innovation Management,32(3), 349–360.
Seiford, L. M., & Zhu, J. (2003). Context-dependent data envelopment analysis-measuring attractiveness and progress. Omega,31(5), 397–408.
Spearman, C. (1961). " general intelligence" objectively determined and measured.
Tervonen, T., Figueira, J. R., Lahdelma, R., Dias, J. A., & Salminen, P. (2009). A stochastic method for robustness analysis in sorting problems. European Journal of Operational Research,192(1), 236–242.
Un. (2004). Who cares wins: Connecting financial markets to a changing world. United Nations Global Compact, Tech: Report.
Voulgaris, F., Doumpos, M., & Zopounidis, C. (2000). On the evaluation of Greek industrial SME’s performance via multicriteria analysis of financial ratios. Small Business Economics,15(2), 127–136.
Wolff, J. A., & Pett, T. L. (2006). Small-firm performance: Modeling the role of product and process improvements. Journal of Small Business Management,44(2), 268–284.
Yu, W. (1992). ELECTRE TRI: Aspects méthodologiques et manuel d’utilisation. LAMSADE: Document- Université de Paris-Dauphine.
Acknowledgements
This study (for the first and third authors) was funded by the European Union - NextGenerationEU, Mission 4, Component 2, in the framework of the GRINS -Growing Resilient, INclusive and Sustainable project (GRINS PE00000018 – CUP E63C22002120006). The views and opinions expressed are solely those of the authors and do not necessarily reflect those of the European Union, nor can the European Union be held responsible for them.
Funding
Open access funding provided by Università degli Studi di Catania within the CRUI-CARE Agreement.
Author information
Authors and Affiliations
Department of Economics and Business, University of Catania, Corso Italia 55, 95129, Catania, Italy
Silvia Angilella & Maria Rosaria Pappalardo
School of Production Engineering and Management, Financial Engineering Laboratory, Technical University of Crete, University Campus, 73100, Chania, Greece
Michalis Doumpos & Constantin Zopounidis
- Silvia Angilella
Search author on:PubMed Google Scholar
- Michalis Doumpos
Search author on:PubMed Google Scholar
- Maria Rosaria Pappalardo
Search author on:PubMed Google Scholar
- Constantin Zopounidis
Search author on:PubMed Google Scholar
Contributions
Silvia Angilella: Conceptualization, Data curation, Formal analysis, Investigation, Methodology, Software, Supervision, Validation, Visualization, Writing - original draft, Writing – review & editing. Michalis Doumpos: Conceptualization, Data curation, Formal analysis, Investigation, Methodology, Software, Supervision, Validation, Visualization, Writing - original draft, Writing – review & editing. Maria Rosaria Pappalardo: Conceptualization, Data curation, Formal analysis, Investigation, Methodology, Software, Validation, Visualization, Writing - original draft, Writing – review & editing. Constantin Zopounidis: Conceptualization, Data curation, Formal analysis, Investigation, Methodology, Software, Validation, Visualization, Writing - original draft, Writing – review & editing.
Corresponding author
Correspondence to Maria Rosaria Pappalardo.
Ethics declarations
Conflict of interest
There are no Conflict of interest.
Additional information
Publisher’s Note
Springer Nature remains neutral with regard to jurisdictional claims in published maps and institutional affiliations.
Supplementary Information
Below is the link to the electronic supplementary material.
Appendix
Appendix
See the Excel file Supplementary material for results about:
-
Pareto-Koopmans efficiency, normalized scores and rankings with the MVKS (for all scenarios \(\lambda\)) and MV models for all criteria in all considered years (i.e. 2018–2022)
-
the SMEs’ dominance relationships in both MV and MVSK models in 2022, scenario \(\lambda =36\).
Rights and permissions
Open Access This article is licensed under a Creative Commons Attribution 4.0 International License, which permits use, sharing, adaptation, distribution and reproduction in any medium or format, as long as you give appropriate credit to the original author(s) and the source, provide a link to the Creative Commons licence, and indicate if changes were made. The images or other third party material in this article are included in the article's Creative Commons licence, unless indicated otherwise in a credit line to the material. If material is not included in the article's Creative Commons licence and your intended use is not permitted by statutory regulation or exceeds the permitted use, you will need to obtain permission directly from the copyright holder. To view a copy of this licence, visit http://creativecommons.org/licenses/by/4.0/.
About this article
Cite this article
Angilella, S., Doumpos, M., Pappalardo, M.R. et al. An enhanced simulation-based approach for multicriteria evaluation of SMEs’ performance. Ann Oper Res (2026). https://doi.org/10.1007/s10479-026-07036-w
Received:
Accepted:
Published:
Version of record:
DOI: https://doi.org/10.1007/s10479-026-07036-w
Provided by the Springer Nature SharedIt content-sharing initiative